Renewable Energy Materials Properties Database (REMPD)

Wind Overview

Wind Plant Description

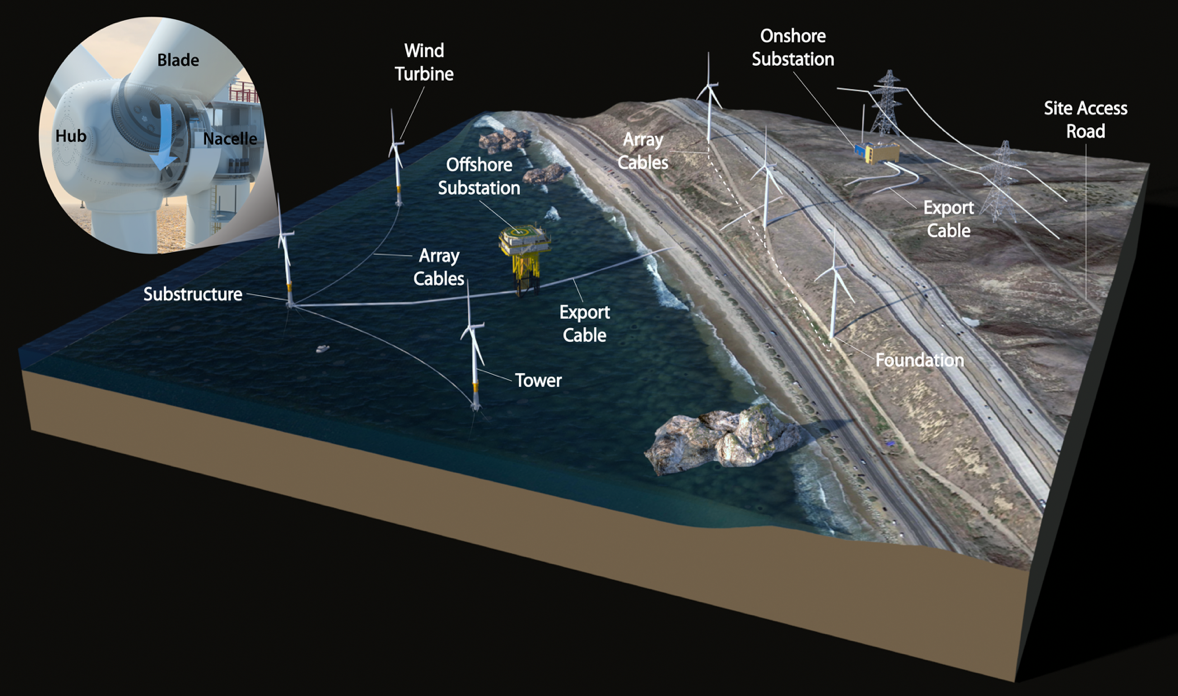
The REMPD includes all components and associated materials required for utility-scale wind energy technologies up to the points of interconnection. For wind energy, this includes foundations or substructures, towers, nacelles, rotors, and balance-of-system components. It does not include transportation and capital equipment required to install, maintain, operate, or decommission wind power plants. Figure 2 illustrates the system components for wind energy in the REMPD, including wind turbines, onshore and offshore substations, and transmission cables.

3 D rendering of System components included in the analysis of wind energy material requirements
Figure 2. System components included in the analysis of wind energy material requirements. Illustration by Joshua Bauer, NREL

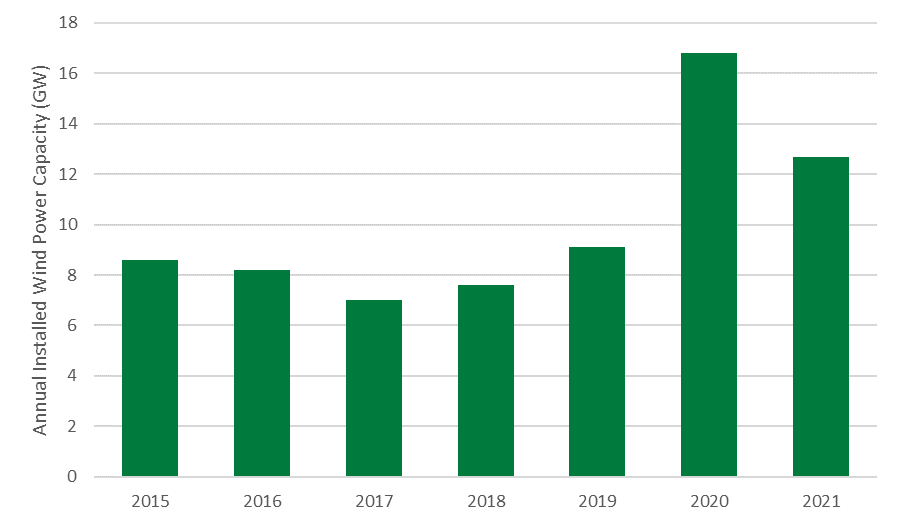
Utility-scale wind turbines included in the REMPD have a rated capacity of at least 1 MW and are installed within large wind plants that require additional infrastructure such as electrical cables and one or more substations. Land-based wind plants also require access roads. Roads are included because they are required throughout the operation of the wind plant; however, delivery and installation equipment, such as trucks, cranes, wrenches, and harnesses do not remain on-site at the wind plant and, therefore, are not included in the database. The REMPD assumes a typical plant size of 200 MW to estimate the amount of material required for land-based wind energy production (Wiser et al. [2021] indicates a wide range of U.S. land-based wind plant sizes, but a 200-MW wind plant size was selected as typical for recently installed land-based wind plants). Offshore wind plant sizes are typically larger than land-based wind plants; the REMPD assumes a typical offshore wind plant capacity of 1,000 MW, based on a range of publicly disclosed planned future offshore plant installations (Musial et al. [2022] indicates a wide range of offshore wind plant sizes, but a 1000-MW offshore wind plant size was selected as typical of new offshore wind plants). Offshore wind plants require different substructures than land-based wind turbine foundations; for example, steel monopiles have been used in many existing installations but other configurations are possible, including floating offshore wind in deep water. Table 3 lists the specific wind energy components and subassemblies that are included in the REMPD.

Table 3. REMPD Wind Energy Component and Subassembly Organizational Structure
Facility Type Component Subassembly (Technology Typea) References for Material Quantities
Land-based wind Array and export ables Totalb Proprietary data from original equipment manufacturers (OEMs)
Foundation Totalb Proprietary data from OEMs; selected Vestas life cycle assessmentsc; Crawford (2009); Eberle et al. (2019); Schreiber, Marx, and Zapp (2019)
Roads Totalb Eberle et al. (2019)
Substation Totalb Proprietary data from OEMs; Alsaleh and Sattler (2019)
Turbine Blade (conventional; segmented) Proprietary data from OEMs; Eberle et al. (2023)
Hub Proprietary data from OEMs; Crawford (2009)
Nacelle (direct drive; gearbox) Proprietary data from OEMs; Alsaleh and Sattler (2019); Martínez et al. (2009); Ozoemena, Cheung, and Hasan (2018); Rajaei and Tinjum (2013)
Tower (conventional; sprial welded; hybrid) Proprietary data from OEMs; Crawford (2009); Guezuraga, Zauner, and Pölz (2012)
Offshore wind Array and export cables Array cable Proprietary data from OEMs; ABB (2010); Arvesen et al. (2014); Ikhennicheu et al. (2020)
Export cable
Onshore cable
Substation Substation equipment Proprietary data from OEMs; Arvesen et al. (2014)
Substation structure
Substructure Gravity base (fixed gravity base) 4C Offshore (2022); Negro et al. (2017)
Jacket (fixed jacket)
Monopile (fixed monopile)
Piles (fixed jacket)
Spar (floating)
Suction buckets (fixed jacket)
Transition piece (fixed monopile)
Turbine Blade (conventional; segmented) Proprietary data from OEMs; Eberle et al. (2023)
Hub Proprietary data from OEMs; Crawford (2009)
Nacelle (direct drive; gearbox) Proprietary data from OEMs
Tower (conventional; sprial welded) Proprietary data from OEMs; Crawford (2009); Guezuraga, Zauner, and Pölz (2012)

  1. The technology type used in the REMPD depends on the analysis scenario defined by the user (e.g., a user can select conventional or spiral welded, or hybrid for land-based wind towers).
  2. Only total component data are available for these components; these data are not broken down by subassembly and instead provide a total value equal to the material requirements for all subassemblies associated with the component.
  3. Selected Vestas LCAs include Vestas (2012, 2017a, 2017b, 2017c, 2017d, 2017e, 2018a, 2018b, 2019, 2022a, 2022b).

The material composition of wind energy technologies can vary significantly depending on the facility type (e.g., land-based or offshore), generation capacity, rotor diameter, tower height, drivetrain technology, and manufacturer. Excluding foundations, roads, and grid connection equipment, wind turbines are typically made of a combination of steel and iron alloys, fiber-reinforced polymers and composites, and other metals and alloys such as copper, bronze, and aluminum (Figure 3). When considering an entire land-based wind power plant, road aggregate, concrete, and steel are the three primary materials by weight, measured in terms of kilograms (kg) per megawatt (MW) of capacity. Concrete is the primary material in wind turbine land-based wind foundations and steel is mainly used in the tower and nacelle. For an entire offshore wind plant, steel is the primary material by weight (kg/MW) and it is used mostly in the substructure, tower, and nacelle. In both land-based and offshore wind plants, glass- or carbon-fiber-reinforced polymers and composites are primarily used in the nacelle and rotor blades; copper and aluminum are used primarily in electrical cables; and a variety of alloys—such as bronze, brass, cast iron, and electrical steel—are used within the nacelle, which houses the drivetrain and power conversion systems.

Typical high-level breakdown of wind energy materials by mass as reported in the REMPD.
Figure 3. Typical high-level breakdown of wind energy materials by mass as reported in the REMPD

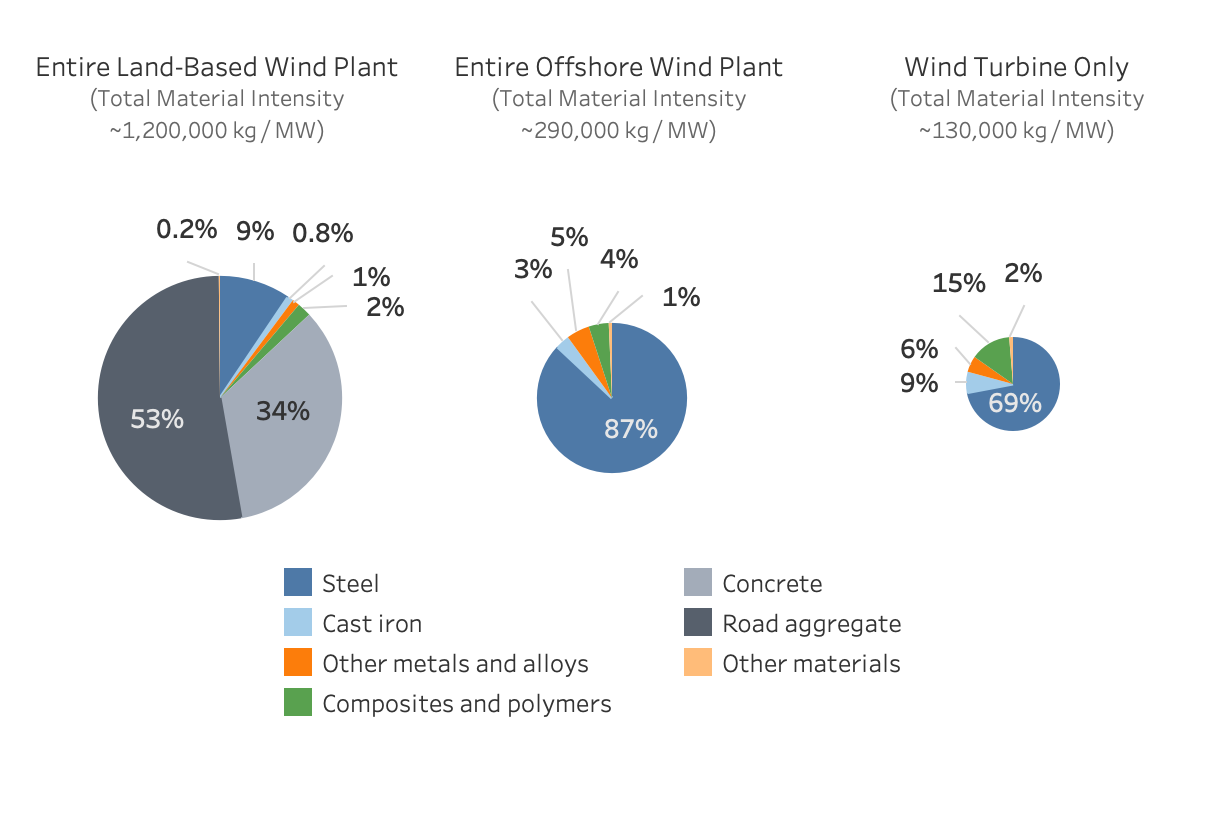
As reported in the REMPD, the main components of a utility-scale wind plant and typical materials used for each component include the following mass amounts for each subsystem:

Wind turbine (80,000–170,000 kg/MW)
  • Blades (11,000–17,000 kg/MW per three blades).
    • The blades primarily comprise composite materials that combine a polymer resin (e.g., epoxy; 2,000–5,000 kg/MW) with glass or carbon fibers (7,000–10,000 kg/MW) and a balsa wood or polymer foam core (1,200–1,300 kg/MW). There are typically three blades per wind turbine.
    • Land-based: 13–18 metric tons per blade
    • Offshore: 65–80 metric tons per blade
  • Hub (4,300–13,000 kg/MW).
    • The hub is made of cast iron (1,200–4,000 kg/MW) and is the structure that connects the blades to the nacelle and tower. Within the hub, the pitch system—which controls the orientation of the blades—predominantly comprises steel and other materials (3,100–9,000 kg/MW).
    • Land-based: 18–44 metric tons per turbine
    • Offshore: 64–179 metric tons per turbine
  • Nacelle (18,000–36,000 kg/MW).
    • The nacelle includes an enclosure that is typically made of fiberglass (300–3,500 kg/MW) over a steel frame (3,500–10,000 kg/MW) and cast-iron bedplate (3,000–5,000 kg/MW). Additional materials (6,800–17,500 kg/MW) used within the nacelle vary depending on the wind turbine configuration and differences between these configurations contribute to the wide range of nacelle masses. A geared turbine requires a gearbox, which contains alloy steel, brass or bronze, and cast iron. Most direct-drive generators use permanent magnets that contain rare-earth elements. The power transformer, which may be located in the nacelle or the tower, contains steel, electrical steel, and copper or aluminum.
    • Land-based: 90–240 metric tons per turbine
    • Offshore: 270–550 metric tons per turbine
  • Tower (44,000–100,000 kg/MW).
    • Most towers are constructed from tubular steel sections, although concrete or a combination of concrete and steel sections can also be used. Variation in the tower mass is primarily driven by different hub heights. Additional quantities of steel, copper, or aluminum are used in power cables and for personnel access equipment.
    • Land-based: 310–340 metric tons per turbine
    • Offshore: 670–710 metric tons per turbine
Land-based foundation (410,000–460,000 kg/MW).
  • Land-based wind turbine foundations are primarily comprised of concrete (390,000–405,000 kg/MW) with steel reinforcement (20,000–55,000 kg/MW).
  • Land-based: 1,400–1,600 metric tons per turbine
Offshore substructure (82,000–360,000 kg/MW).
  • Offshore wind turbine substructures—including monopiles, jackets, and floating platforms—are typically made from steel plate.
  • Offshore: 1,400–1,600 metric tons per turbine
Array and export cables (5,000–31,000 kg/MW).
  • Electrical cables use aluminum or copper conductors and polymer insulating material (e.g., polyethylene). Submarine cables, which are used for offshore wind energy, require additional layers of lead or steel surrounding the conductive core(s). The total mass of cables varies widely depending on the distance from a wind plant to the electrical grid, the choice of material (aluminum is lighter than copper), the electrical capacity of the cable, and whether the cable is installed overhead, buried, or subsea.
  • Land-based: 5–20 kg per meter of cable
  • Offshore: 15–50 kg per meter of cable
Substation (2,500–8,000 kg/MW).
  • Substations require steel (200–1,300 kg/MW) and electrical steel (200–1,600 kg/MW) for power transformers and switchgear and copper (40–700 kg/MW) for wiring. Offshore substations require a steel support structure (7,000 kg/MW), whereas land-based substations use concrete foundations (200–3,600 kg/MW).
  • Land-based: 400–1,800 metric tons per wind power plant
  • Offshore: 7,000–8,000 metric tons per wind power plant
Roads (480,000–590,000 kg/MW).
  • Site access roads within a wind power plant are typically made from aggregate comprising crushed stones, gravel, or recycled concrete.
  • Land-based: 100,000–120,000 metric tons per wind power plant
Miscellaneous.
  • Additional materials that are not specifically detailed here, but are available in further specified in the database, include protective coatings and paints that contain zinc (for corrosion resistance) or polymers such as epoxy. Electronic controls, sensors, lighting, and safety equipment contain various materials, notably semiconductors, which contain critical minerals.

Vulnerable Wind Materials

We use the term "vulnerable material" to describe any nonfuel mineral, element, substance, or material that the DOE Office of Energy Efficiency and Renewable Energy determines has a high risk of a supply chain disruption and serves an essential function in one or more energy technologies, including technologies that produce, transmit, store, and conserve energy; or a critical mineral (as defined by the United States Geological Survey [USGS]). Table 4 provides an overview of critical minerals and their relevance to wind energy technology. Vulnerable wind materials include these critical minerals as well as other materials that play an important role in wind energy generation facilities and have a high risk of supply chain disruption (such as electrical steel).

Critical Minerals and Their Relevance to Wind Energy Technology

In its most recently published list (USGS 2022b), USGS identified 50 critical minerals, which are shown in Table 4 categorized by their relevance to wind energy technologies. The table indicates that fewer than 20 of them have a significant role in wind energy.

Table 4. Critical Minerals (USGS 2022b) and Their Relevance to Wind Energy
Type of Material Role in Wind Energy Generation Facilities

Aluminum

Power cables, nacelle/tower internal equipment

Chromium, cobalt, manganese, nickel, niobium, titanium, vanadium

Steel alloying elements

Graphite, lithium, nickel

Batteries

Dysprosium, neodymium, praseodymium, terbium

Rare-earth permanent magnets

Gallium

Wide-bandgap semiconductors for power electronics

Tin

Bronze

Zinc

Anticorrosion coatings (galvanization)

Antimony, arsenic, barite, beryllium, bismuth, cerium, cesium, erbium, europium, fluorspar, gadolinium, germanium, hafnium, holmium, indium, iridium, lanthanum, lutetium, magnesium, palladium, platinum, rhodium, rubidium, ruthenium, samarium, scandium, tantalum, tellurium, thulium, tungsten, ytterbium, yttrium, zirconium

Minor or no role

The minerals used in wind turbines with the highest supply risk are neodymium, dysprosium, and praseodymium (Nassar et al. 2020). These metals are mainly contained in the permanent magnets used in the generator for direct-drive wind turbines. Certain minerals used in steel alloying (i.e., nickel and cobalt) may also present supply challenges under high levels of wind deployment (Eberle et al. 2023).

Wind Technology Materials Summary

Annual installations of land-based wind power generating capacity in the United States between 2015 and 2021 are presented in Figure 4. The average annual capacity addition during this time frame was 10 gigawatts (GW) per year (Wiser et al. 2021; American Clean Power [ACP] 2022). Only 42 MW of offshore wind capacity were installed between 2016 and 2021, representing all of the offshore wind energy capacity in the United States as of 2022.

Bar chart of U.S. land-based wind power capacity additions.
Figure 4. U.S. land-based wind power capacity additions. Sources: Wiser et al. (2021) and American Clean Power (2022)

There are more than 200 unique finished materials and more than 1,700 unique raw materials in the REMPD. To protect proprietary data in the publicly accessible database, these materials are aggregated into 45 material types. To improve the interpretability of the data in this report, we grouped these materials into seven major categories:

  1. Concrete
  2. Aggregate
  3. Steel
  4. Composites and polymers
  5. Cast iron
  6. Other metals and alloys
  7. Other materials

These seven categories are used in Figure 3 and Table 5 to summarize the material quantities required in U.S. wind power plants.

Tables 5, 6, and 7 provide examples of the type, source, significant uses, country of origin, projected availability, and quantity data that are available in the REMPD for current wind energy technologies. Table 5 provides a high-level overview of material intensities for current wind energy technologies; the range of material intensities reported reflect variations in material use between specific models and maintain the confidentiality of proprietary data. Vulnerable wind materials are included within the relevant categories in Table 5 and are defined further in Table 6, which provides material intensities specific to each type of vulnerable material. Although Table 5 shows a categorization of all materials used in wind plants, Table 6 and Table 7 show a subset of these materials, the subset being vulnerable materials (defined above). The amount of material needed for current annual wind energy deployment can be estimated by multiplying the current material intensity in Tables 5 and 6 by an annual capacity addition of wind energy. Table 7 summarizes the quantity of vulnerable materials needed for current and potential future annual wind deployment levels and summarizes the current production and projected availability of these materials in millions of kilograms (kg).

Table 5. Current Wind Plant Materials
Material Category Primary Role in Wind Energy Generation Facilities Other Significant Usesa Land-Based Wind Material Intensity (kg/MW) Offshore Wind Material Intensity (kg/MW) Source (Percentage of Global Production by Country of Origin)a

Concrete

Land-Based foundation, substation, towerb

Construction

394,000–414,000

Minimal

Widely available globally

Road aggregate

Roads

Construction (primarily road construction)

552,000–674,000

Not used

Widely available globally

Steel

All (tower, hub, nacelle, blade, land-based foundation, offshore substructure, cables, substation

Construction, transportation (automotive), metal products, machinery and appliances

107,000–179,000

130,000–419,000

China (54%)
India (6%)
Japan (5%)
United States (5%)
Others (30%)

Composites and polymers

Blade, nacelle, cables, land-based foundation, substation, hub, tower

Consumer goods, packaging, transportation (automotive, marine, aerospace)

18,000–39,000

10,000–28,000

China (8%)
Canada (8%)
Germany (6%)
Russia (5%)
Saudi Arabia (9%)
South Korea (8%)
Thailand (7%)
United States (5%)
Others (44%)

Cast iron

Nacelle, hub, substation

Construction, machinery and appliances

9,000–15,000

7,000–14,000

China (63%)
India (6%)
Japan (6%)
Others (25%)

Other metals and alloys

All

Various

10,000–28,000

7,000–37,000

Various

Other materials

All

Various

1,000–5,000

1,000–5,000

Various

  1. Data are primarily drawn from the USGS Metals and minerals: U.S. Geological Survey Minerals Yearbooks (most recent available, 2018-2022) and are supplemented with data from the National Ready Mixed Concrete Association, the UN Comtrade Database, BloombergNEF (2020a, 2020b).
  2. Denotes component/material combinations that are not used in all wind power plants. For example, geared induction generators do not use rare-earth permanent magnets.
Table 6. Vulnerable Materials in Current Wind Power Plants
Type of Material Primary Role in Wind Energy Generation Facilities Other Significant Usesa Land-Based Wind Material Intensity (kg/MW) Offshore Wind Material Intensity (kg/MW) Source (Percentage of Global Production by Country of Origin)a

Carbon fiber

Blades

Transportation (aerospace, automotive, marine), consumer goods (pressure vessels, sports equipment)

590–2,300

580–1,180

United States (28%)
Japan (13%)
China (13%)
Turkey (12%)
Hungary (5%)
Taiwan (5%)
Others (24%)

Electrical steel

Nacelle, substation

Machinery and appliances (transformers, motors, inductors)

1,500–5,300

2,700–3,600

South Korea (14%)
China (14%)
Japan (12%)
Germany (11%)
Russia (10%)
Others (39%)

Critical Minerals

Aluminum

Nacelle, tower, cablesb

Transportation (aviation and automotive), consumer goods, packaging, construction, electrical, machinery, appliances

2,900–4,200

600–2,600

China (57%)
Russia (6%)
India (5%)
Canada (5%)
Others (27%)

Chromium

Nacelle, tower, land-based foundation, offshore substructure, hub

Steel (stainless and heat-resisting steel), other steel alloys

1,200–4,000

180–510

South Africa (36%)
Turkey (22%)
Kazakhstan (19%)
India (7%)
Finland (6%)
Others (10%)

Cobalt

Nacelle, land-based foundation, offshore substructure, tower

Alloys (superalloys, other alloys), chemicals, steels

3–6

3–7

Congo (73%)
Russia (5%)
Others (22%)

Dysprosiumc

Generatorb

Magnets, ceramics and glass, battery alloys, catalysts

2–8

6–8

China (58%)
United States (16%)
Burma (12%)
Australia (7%)
Others (7%)

Gallium

Nacelle, land-based foundation, offshore substructure, tower

Electronics (integrated circuits, optoelectronic devices)

0.05–0.1

0.03–0.1

China (97%)
Others (3%)

Graphite (natural)

Tower

Metal products (bearings, brake lining, lubricants), rubber

3–17

5–9

China (79%)
Brazil (7%)
Others (14%)

Lithium

Tower

Batteries, ceramics and glass, lubricating greases

0.7–3

0.9–2

Australia (48%)
Chile (26%)
China (16%)
Argentina (7%)
Others (3%)

Manganese

Nacelle, land-based foundation, offshore substructure, tower

Steel

1,900–3,000

2,400–7,800

South Africa (34%)
Australia (18%)
Gabon (18%)
China (7%)
Others (23%)

Neodymiumc

Generatorb

Magnets, ceramics and glass, battery alloys, catalysts

40–160

90–150

China (58%)
United States (16%)
Burma (12%)
Australia (7%)
Others (7%)

Nickel

Nacelle, land-based foundation, offshore substructure, tower

Steel (stainless and heat-resisting steel), superalloys, batteries

2,200–4,800

1,900–6,100

Indonesia (31%)
Philippines (13%)
Russia (11%)
New Caledonia (8%)
Australia (7%)
Canada (7%)
China (5%)
Others (18%)

Niobium

Nacelle, land-based foundation, offshore substructure, tower

Steel, superalloys

0.3–0.5

0.4–1.2

Brazil (90%)
Canada (10%)

Praseodymium

Generatorb, land-based foundation, tower

Magnets, ceramics and glass, battery alloys, catalysts

0.5–0.8

44–88

China (58%)

United States (16%)
Burma (12%)
Australia (7%)
Others (7%)

Terbiumc

Generatorb, land-based foundation, substation, tower

Magnets, ceramics and glass, battery alloys, catalysts

< 0.0001

0.4–0.8

China (58%)
United States (16%)
Burma (12%)
Australia (8%)
Others (6%)

Tin

Nacelle, tower, land-based foundation, offshore substructure, substation

Alloys, coatings (tinplate), chemicals, metal products (solder)

0.2–0.3

0.4–1.0

China (32%)
Indonesia (20%)
Burma (11%)
Peru (8%)
Congo (7%)
Bolivia (6%)
Brazil (6%)
Others (10%)

Titanium

Nacelle, tower, land-based foundation, offshore substructure

Steel, superalloys

49–77

61–200

China (53%)
Japan (21%)
Russia (13%)
Kazakhstan (7%)
Others (6%)

Vanadium

Nacelle, cables, land-based foundation, offshore substructure, tower

Steel, other alloys, catalysts

0.0002–0.0005

0.0001–0.0006

China (67%)
Russia (19%)
South Africa (8%)
Brazil (6%)

Zinc

Tower, nacelle, land-based foundation, offshore substructure, cables

Coatings (galvanization), rubber, chemicals, paint, agriculture

30–110

20–130

China (34%)
Australia (11%)
Mexico (5%)
Peru (11%)
United States (6%)
India (6%)
Others (27%)

  1. Data are primarily drawn from the USGS Metals and minerals: U.S. Geological Survey Minerals Yearbooks (most recent available, 2018-2022) and are supplemented with data from the National Ready Mixed Concrete Association, the UN Comtrade Database, BloombergNEF (2020a), and Alves Dias et al. (2020).
  2. Denotes component/material combinations that are not used in all wind power plants. For example, geared induction generators do not use rare-earth permanent magnets.
  3. The source and other significant uses information reported for dysprosium, neodymium, praseodymium, and terbium correspond to data for all rare-earth compounds and metals (they are not specific to each of the individual elements) because these data are not available at the level of individual elements.
Table 7. Quantity and Availability of Vulnerable Wind Materials Needed To Satisfy Annual U.S. Wind Deployment

Type of Material

U.S. Import Sources

(2016–2019)

Current Productiona (millions of kg/year)

Projected Availabilityb (millions of kg)

Quantity Needed for Annual U.S. Wind Deployment

(millions of kg/year)

Percentage of Current Production Required for U.S. Wind Deploymente

Current Levels

(10 GW/yr)c

Potential Future Levels

(90 GW/yr)d

Current Levels

(10 GW/yr)c

Potential Future Levels

(90 GW/yr)d

Carbon fiber

Data not available

192

N/A

6–23

53–200

3%–12%

28%–104%

Electrical steel

Japan (21%)
Korea (21%)
France (13%)
Austria (11%)
China (6%)
Others (28%)

20,000

N/A

15–53

150–460

0.08%–0.3%

0.8%–2%

Critical Minerals

Aluminum

Canada (50%)
United Arab Emirates (10%)
Russia (9%)
China (5%)
Others (26%)

65,200

32,000,000

29–42

240–360

< 0.1%

0.4%–0.5%

Chromium

South Africa (39%)
Kazakhstan (8%)
Mexico (6%)
Russia (6%)
Others (41%)

37,000

570,000

12–39

97–320

0.03%–0.1%

0.3%–0.9%

Cobalt

Norway (20%)
Canada (14%)
Japan (13%)
Finland (10%)
Others (43%)

165

7,600

0.03–0.06

0.2–0.5

< 0.1%

0.1%–0.3%

Dysprosiumf

China (80%)
Estonia (5%)
Japan (4%)
Malaysia (4%)
Others (7%)

2.4

44

0.02–0.08

0.2–0.7

0.8%–3%

9%–28%

Gallium

China (55%)
United Kingdom (11%)
Germany (10%)
Others (24%)

0.33

100

0.0005–0.001

0.004–0.01

0.2%–0.4%

1%–3%

Graphite (natural)

China (33%)
Mexico (23%)
Canada (17%)
India (9%)
Others (18%)

970

320,000

0.03–0.17

0.3–1.5

< 0.1%

0.03%–0.2%

Lithium

Argentina (55%)
Chile (36%)
China (5%)
Others (4%)

83

22,000

0.007–0.03

0.06–0.3

< 0.1%

0.1%–0.4%

Manganese

Gabon (20%)
South Africa (19%)
Australia (15%)
Georgia (10%)
Others (36%)

19,000

1,500,000

19–30

180–320

0.1%–0.16%

0.9%–1.7%

Neodymiumf

China (80%)
Estonia (5%)
Japan (4%)
Malaysia (4%)
Others (7%)

40.8

1,200

0.4–1.6

4–14

1%–4%

10%–35%

Nickel

Canada (42%)
Norway (10%)
Finland (9%)
Russia (8%)
Other (31%)

2,500

95,000

22–48

190–440

0.9%–1.9%

7%–18%

Niobium

Brazil (66%)
Canada (22%)
Others (12%)

65

18,000

0.003–0.005

0.03–0.05

< 0.1%

< 0.1%

Praseodymiumf

China (80%)
Estonia (5%)
Japan (4%)
Malaysia (4%)
Others (7%)

14.4

370

0.005–0.008

0.5–0.9

< 0.1%

3%–7%

Terbiumf

China (80%)
Estonia (5%)
Japan (4%)
Malaysia (4%)
Others (7%)

0.5

10

< 0.0001

0.004–0.008

< 0.1%

1%–2%

Tin

Indonesia (24%)
Malaysia (21%)
Peru (20%)
Bolivia (17%)
Other (18%)

Scrap: Canada (99%)

260

4,900

0.002–0.003

0.02–0.04

< 0.1%

< 0.1%

Titanium

Japan (90%)
Kazakhstan (7%)
Others (3%)

230

750,000

0.5–0.8

5–8

0.2–0.3%

2%–4%

Vanadium

Canada (26%)
China (14%)
Brazil (10%)
South Africa (9%)
Others (41%)

105

24,000

< 0.0001

< 0.0001

< 0.1%

< 0.1%

Zinc

Peru (98%)
Others (2%)

12,000

250,000

0.3–1.1

3–10

< 0.1%

< 0.1%

  1. The quantity of material that is currently produced globally as of the latest available data (2018-2020). Data are primarily drawn from the USGS Metals and minerals: U.S. Geological Survey Minerals Yearbooks (most recent available, 2018-2022) and are supplemented with data from S&P Global (2021), BloombergNEF (2020a), and Alves Dias et al. (2020).
  2. The quantity of material that could be available globally in the future, as measured using total known reserves. Data are primarily drawn from the USGS (2022a) and are supplemented with data from Alves Dias et al. (2020).
  3. The quantity needed for current levels of annual wind energy deployment for each material is estimated by multiplying the material intensity in Table 6 by the average annual capacity addition of wind energy from 2015 to 2021: 10 GW per year (Wiser et al. [2021]; ACP [2022]). Because less than 100 MW of offshore wind capacity was installed between 2015 and 2021, the values reported here assume that all 10 GW per year come from land-based wind technology.
  4. The potential quantity needed for future annual wind energy deployment for each material is estimated by multiplying the material intensity in Table 6 by a total of 90 GW/yr (comprised of 80 GW of land-based wind and 10 GW of offshore wind). This level of deployment is based on the average level of deployment between 2030 and 2050 required in the All Options scenario from Denholm et al. (2022), which achieves 100% clean electricity by 2035 and puts the United States on a path to net-zero emissions by 2050. In August 2022, Congress passed the Inflation Reduction Act (IRA), which has several provisions that incentivize wind and solar energy deployment. The estimates of future annual capacity additions used here incorporate anticipated effects of these incentives; however, full details on how the IRA will be implemented were not available when this report was completed. Specific assumptions used in deployment scenarios are described in Denholm et al. (2022).
  5. The relative amount of material needed for U.S. energy technologies compared to current global production, calculated by dividing the "Quantity Needed for Current Annual Wind Deployment" by "Current Production" and multiplying by 100%.
  6. The U.S. import sources reported for dysprosium, neodymium, praseodymium, and terbium correspond to data for all rare-earth compounds and metals (they are not specific to each of the individual elements) because these data are not available at the level of individual elements.

Ability To Explore Future Wind Technology and Demand

In addition to identifying current material needs, the REMPD can be used to assess the types and quantities of materials required to develop the wind turbines associated with future deployment scenarios. In the REMPD, an analysis scenario is defined by combining three factors:

  1. Capacity projection, which defines the annual amount of renewable-energy-generating capacity that is anticipated each year over the period of interest.
  2. Facility configuration, which describes the quantitative properties (e.g., the wind turbine rating, wind plant capacity, rotor diameter, and hub height) associated with each type of facility, which can vary over time.
  3. Technology configuration, which identifies the market share for each type of technology that is used within each facility and allows for the exploration of technology innovations (e.g., superconducting direct-drive generators).

From the capacity projection, facility configuration, and technology configuration factors defined in the scenario, the REMPD determines the required materials. The REMPD's scenario analysis capabilities can be used to understand the constraints and vulnerabilities linked to physical materials production and manufacturing supply chains and help identify new technologies that could mitigate resource constraints.

In the Wind Quantity section, we use the REMPD's scenario analysis capabilities to estimate projected annual material quantities for all U.S. wind plants under two future wind deployment scenarios: Current Policies and High Deployment. Table 8 describes how we defined each of these two scenarios. More details about these scenarios, along with supporting analysis of the quantities and availability of wind energy materials under these two future scenarios, can be found in Eberle et al. (2023).

Table 8. Descriptions of Scenarios Used to Develop Projections of Material Quantities Needed to Meet U.S. Wind Energy Demand

Current Policies Scenario

High Deployment Scenario

Generic description

Limited changes to plant configurations, business-as-usual levels of deployment, and no significant materials-related technology innovations

Significant technology innovations enable large-scale increases in turbine size, high levels of deployment, with limited materials-related innovations

Capacity Projectiona

Mid-case scenario from NREL's Standard Scenarios, which represents a medium level of wind energy deployment, as required to satisfy electricity demand. The scenario assumes no new decarbonization policies and no deployment of nascent technologies.

All Options scenario from Denholm et al. (2022), which achieves 100% clean electricity by 2035 and puts the United States on a path to net-zero emissions economy wide by 2050.

Plant Configuration

Linear interpolation of turbine and plant characteristics from the 2022 Annual Technology Baseline (ATB) Baseline (2020) configuration to the Conservative (2030) configuration and linear extrapolation of 2020-2030 scaling trends through 2050 (up to a maximum hub height of 200 m, rotor diameter of 331 m, and turbine rating of 25 MW for offshore wind and a maximum hub height of 140 m for land-based wind)

Linear interpolation of turbine and plant characteristics from the 2022 ATB Baseline (2020) configuration to the Advanced (2030) configuration and linear extrapolation of 2020-2030 scaling trends through 2050 (up to a maximum hub height of 200 m, rotor diameter of 331 m, and turbine rating of 25 MW for offshore wind and a maximum hub height of 140 m, rotor diameter of 210 m, and turbine rating of 8 MW for land-based wind)

Technology Configuration

Low technology innovation, which is representative of current technology (e.g., thermoset blades)

Moderate materials-related technology innovation, including segmented blades and carbon fiber spar caps for land-based systems, advanced steel towers (spiral welding) for 25% of land-based systems, and hybrid tower systems for 25% of land-based systems

References